
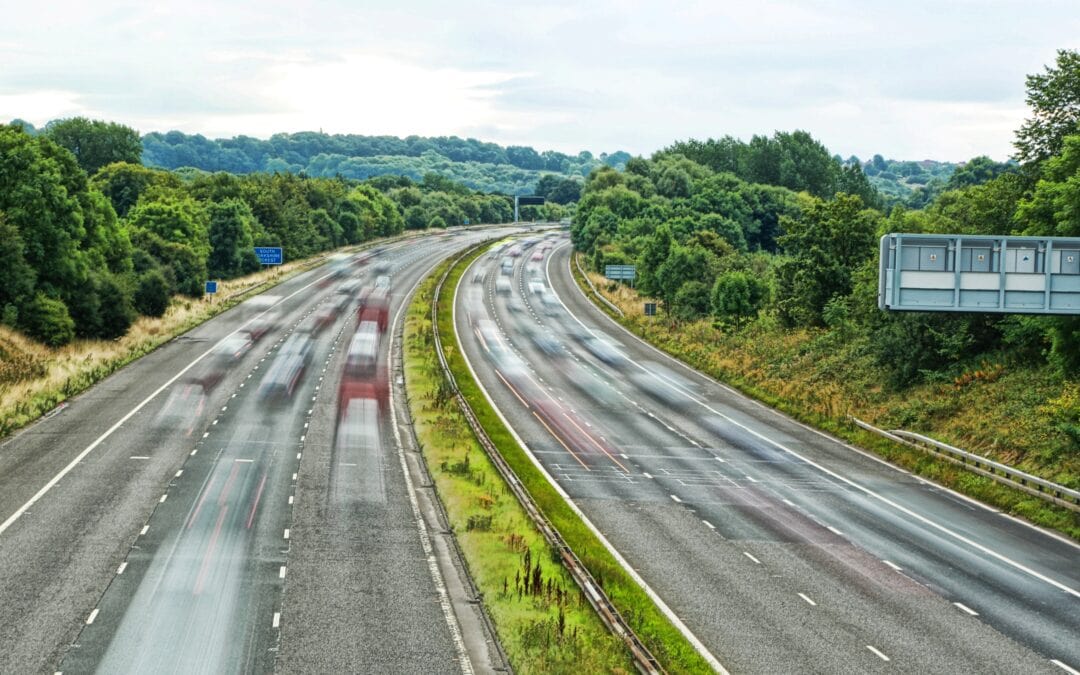
Official statistics from the Department for Transport revealed the UK’s deadliest regions and roads to drive. Their study involved the analysis of figures spanning 5 years and they highlight the dangers of rural roads in Britain.
The Most Dangerous Regions: Fatal Accidents per 100,000 people
Area | Average Annual Fatal Accidents per 100,000 People |
| Powys | 8.00 |
| East Lindsey | 7.53 |
| Perth & Kinross | 7.14 |
| Highland | 6.96 |
| Aberdeenshire | 5.43 |
| Cheshire East | 4.31 |
| Northumberland | 4.14 |
| East Riding of Yorkshire | 3.95 |
| Central Bedfordshire | 3.81 |
| Doncaster | 3.48 |
| Cornwall | 3.37 |
| Leeds | 3.20 |
| Cheshire West and Cheshire | 3.17 |
| Shropshire | 3.08 |
| Wiltshire | 3.07 |
| Sheffield | 2.16 |
| County Durham | 2.06 |
| Manchester | 2.02 |
| Birmingham | 1.82 |
The Most Dangerous Roads: Fatal Accidents per 100km of Road
Road | Fatal accidents per 100km |
| A61 | 0.40 |
| A31 | 0.12 |
| A1(M) | 0.11 |
| A20 | 0.07 |
| A13 | 0.06 |
| A505 | 0.05 |
| A2 | 0.05 |
| A3 | 0.05 |
| M40 | 0.04 |
| A4 | 0.04 |
| A10 | 0.04 |
| A6 | 0.03 |
| A50 | 0.03 |
| A12 | 0.03 |
| A35 | 0.03 |
| A52 | 0.03 |
| M4 | 0.03 |
| A15 | 0.03 |
| A49 | 0.03 |
| A57 | 0.03 |
The Most Dangerous Road Type: Rural, Urban and Motorways
Rural | Urban | Motorways | |
Fatalities | 1,030 (58%) | 646 (36%) | 107 (6%) |
All Casualties | 52,287 (33%) | 100,931 (63%) | 7,309 (4%) |
How We Can Help to Keep Your Staff and Vehicles Safe
Dropapin can help to reduce the risks that drivers face on the roads in several ways.
Firstly, our software allows you to track various driving behaviours, such as braking, acceleration and speed. As a result, managers can assess whether their staff are driving safely on the roads and behaving in the correct manner as a representative of their company. Using this information, drivers can then make informed decisions about what improvements they can make to reduce their risk of road accidents e.g. Braking less harshly or reducing speeds. Furthermore, Dropapin’s playback feature enables users to view which routes have been travelled by drivers. In turn, managers can understand whether their drivers are choosing the fastest and safest routes possible.
Final Thoughts
Thank you for taking the time to read our article. We hope you now have a better understanding of driving in the UK and how to keep safe using our software. If you have any questions regarding any of the topics discussed in this article, please don’t hesitate to get in touch. A member of our expert team will always be happy to help.
